Data Visualization Tool Allows Raleigh Residents to Monitor Development
For a moment, imagine visualizing alternative futures with immediate feedback from a diverse group of neighbors, developers and government leaders. You wonder, “What happens if we add a three-story building here or put a one-level retail outlet there?”
Instead of developers needing time to look over their maps, think it through and come back with an answer, you can see the landscape model change right in front of you. Right away, decisions become clearer and voices become stronger.
With InVision Raleigh, this ideal is becoming a reality. In partnership with the City of Raleigh and Esri — a world-renowned builder of mapping and spatial analytics software — NC State University Faculty Fellow Perver Baran, of the Center for Geospatial Analytics, and her team collaborated to develop an innovative, 3D public engagement tool to visualize development.
An online application, the tool’s purpose is to be available to anyone at any time, changing how citizens engage in government. The tool doesn’t require attendance at events, and users don’t need special training to engage with it.
Empowering the Public
Baran explained how significant this access is. For years, urban developers have used 2D maps to plan expansions and growth. They’ve also used physical models, and in recent decades, have added digital 3D models. The trouble with these is their limitations.
With physical models, individuals have to visit physical locations, which creates constraints partly because of scheduling challenges. People can’t always drop-in at public hearings. Physical models also can’t be modified in the moment when someone has a question about a new building or sidewalk.
Digital 3D models are more complicated tools with sophisticated analogies. But even open source desktop versions aren’t often available to the public. If they are, they require extensive training and expertise. InVision Raleigh addresses these constraints with online availability, removing barriers to access for residents who want to be engaged civically. This means a broader range of stakeholders can provide input about what new development will look like in the context of specific conditions.
Baran says this is one of the most important elements of the tool. Another benefit is access to immediate feedback, coupled with the ability to make instant changes. The impact of development is clearer to participants because they see it. No one has to describe it to them.
“Visualization is a hallmark of geospatial analytics,” Baran says.
Initially, one of the biggest challenges her team faced was thinking conceptually about what the tool would look like when they paired the right technology with geospatial imaging, so Baran pulled in Research Associate Makiko Shukunobe, and Reza Amindarbari, a PhD student, to help.
Promoting Sustainable Growth
What they came up with — using data available from the City of Raleigh — was an engaging prototype 3D model that’s available online.
Inside the app, users see Raleigh in 3D. Grey buildings are existing structures, while colored buildings are proposed development. Clicking on either will show information such as the building’s dimensions, the number of floors and the zoning for each floor.
Another few clicks and users can add buildings of their own, specifying the width, depth and rotation of the new structures along with the space used for each: retail, office or residential.
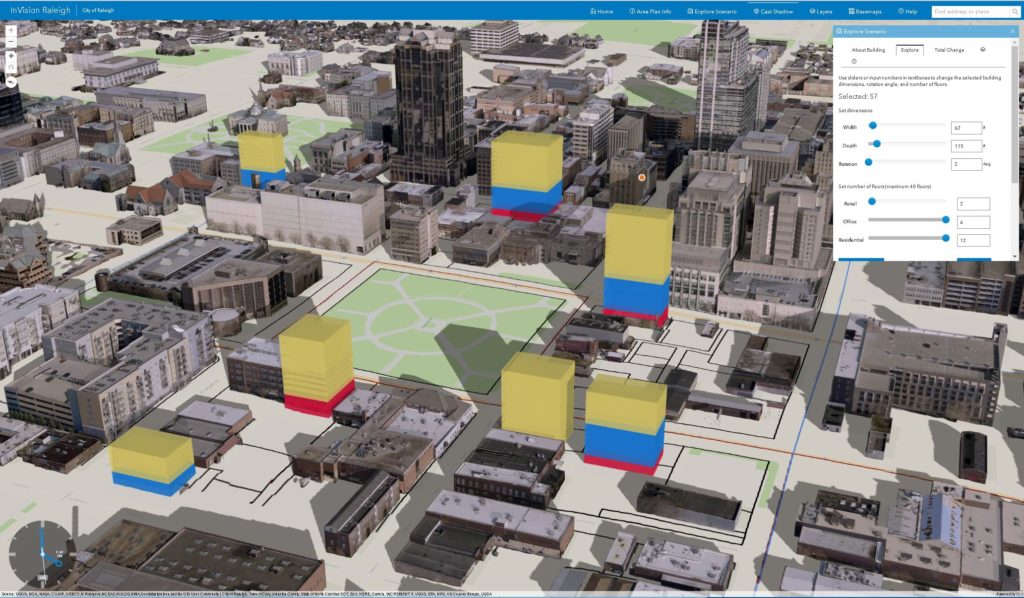
“The tool is interactive. You can add buildings, change the positions of the buildings, modify the dimensions and test different blends of residential, retail and office spaces within the buildings by changing the number of floors dedicated to these space uses,” Baran says.
The tool ultimately emphasizes the importance of thinking within the context of a specific area when adding new buildings, according to Baran.
Baran and her team are continuing to raise awareness about this resourceful tool. In 2018, Esri awarded the Center for Geospatial Analytics and the City of Raleigh a joint Special Achievement in GIS award for their collaboration on the project.
The next steps for the team include presentations at conferences and a potential pilot project. They hope to keep expanding the tool’s functionality as they engage more communities and empower the public in the process.
Post by Julie Johnson
- Categories: